- Research
- Open access
- Published:
Pharmacokinetics and pharmacodynamics of enrofloxacin treatment of Escherichia coli in a murine thigh infection modeling
BMC Veterinary Research volume 17, Article number: 212 (2021)
Abstract
Background
Enrofloxacin is an antibacterial drug with broad-spectrum activity that is widely indicated for veterinary use. We aim to develop the clinical applications of Enrofloxacin against colibacillosis by using the neutropenic mice thigh infection model.
Results
The minimum inhibitory concentration (MIC) distribution of 67 isolated E. coli strains to ENR was calculated using CLSI guidelines. Whereas, the MIC50 value calculation was considered as the population PD parameter for ENR against E. coli strains. The MIC values of 15 E. coli strains were found to be nearest to the MIC50 i.e., 0.25 μg/mL. Of all the tested strains, the PK-PD and E. coli disease model was established via selected E. coli strain i.e., Heilong 15. We analyzed the PK characteristics of ENR and its metabolite ciprofloxacin (CIP) following a single subcutaneous (s.c.) injection of ENR (1.25, 2.5, 5, 10 mg/kg). The concentration-time profiling of ENR within the plasma specimens was determined by considering the non-compartmental analysis (NCA). The basic PK parameters of ENR for the peak drug concentration (Cmax) and the area under the concentration-time curve (AUC) values were found to be in the range of 0.27–1.97 μg/mL and 0.62–3.14 μg.h/mL, respectively. Multiple s.c. injection over 24 h (1.25, 2.5, 5, 10 mg/kg at various time points i.e., 6, 8, 12, and 24 h respectively) were administered to assess the targeted PD values. The Akaike Information Criterion (AIC) was used to choose PD models, and the model with the lowest AIC was chosen. The inhibitory Emax model was employed to calculate the related PK-PD parameters. The results of our study indicated that there was a strong correlation between the AUC/MIC and various antibacterial activities (R2 = 0.9928). The target values of dividing AUC/MIC by 24 h for bacteriostatic action were 1-log10 reduction, 2-log10 reduction, and 3-log10 reduction 0.325, 0.4375, 0.63, and 0.95 accordingly.
Conclusion
The identified pharmacodynamics targets for various antibacterial effects will be crucial in enhancing ENR clinical applications and serving as a key step in reducing bacterial resistance.
Background
Escherichia coli (E. coli) is a Gram-negative bacterium that is responsible for a variety of animal diseases, including septicemia, enterocolitis, and diarrhea [1, 2]. Colibacillosis is an infectious syndrome caused by pathogenic E. coli, that has been linked to high rates of mortality and morbidity around the world, as well as significant losses in the poultry and livestock industries.
ENR is an effective broad-spectrum antibiotic, and is generally used against a wide range of pathogenic bacteria. It can be particularly used in the livestock and poultry industries to combat a variety of infectious diseases caused by E. coli. ENR is a third-generation fluoroquinolone widely used in veterinary medicines as an antimicrobial drug [3]. It is evident from the study that gram-negative bacteria appeared to be more sensitive to ENR treatment. However, fluoroquinolone resistance is emerging at an alarming level and because of this problem, the PK-PD model was used to design a reasonable drug dosage regimen. Thus, several approaches have been recommended, including the use of drug combinations to significantly enhance the antibacterial effects [4].
PK-PD modeling has been a significant strategy for providing an optimal dose regimen to prevent resistance problems [5]. The model can establish the relationship between drug concentration, antimicrobial effect, and time. Based on the scientific calculation, the model can provide the optimal dose regimen and dose interval [6]. Certain PK parameters (i.e., AUC and Cmax) and PD parameters (i.e., minimal inhibitory concentration (MIC) and time-kill curve) are commonly considered to integrate the PK-PD model. PK-PD indexes comprised the ratio of AUC divided by the MIC (AUC/MIC). The percentage time when exceeded from the drug MIC (%T > MIC) and the ratio was obtained from the peak concentration divided by the MIC (Cmax/MIC). However, when using the PK-PD index AUC/MIC values for the evaluation of breakpoints, the AUC/MIC has a time dimension (h) that makes it difficult for readers to comprehend and scientists to discuss. On the other hand, the scalar obtained by dividing the AUC/MIC by time interval gives values that are easier to understand. Moreover, dividing the AUC/MIC by time interval allows the assessment of a truly dimensionless ratio, and the computed numerical value has also directed clinical interpretation [7]. Based on the antibacterial effect of drugs, they can be categorized into concentration-dependent and time-dependent drugs. In the case of concentration-dependent drugs, fluoroquinolones are the more prominent, and their AUC/MIC and Cmax/MIC ratios comparatively indicated significant PK-PD indexes, as compared to %T > MIC for the antibacterial activity [8, 9].
The correlation between the host, pathogens, and the drug is usually determined via the neutropenic mice thigh infection model [10, 11]. The stability, maturity, and avoidance of the host immune system’s impact on the antibacterial effect are all major advantages of this model. In this context, Ferran et al., evaluated the resistance of marbofloxacin (fluoroquinolones) in E. coli strains by using the neutropenic mice thigh model of bacterial infection [12]. However, the in-vivo study of the combined effect of PK and PD to test ENR antibacterial effect against E. coli in the thigh model of bacterial infection in neutropenic mice has never been studied before.
Herein, we adopted the neutropenic mice thigh model of bacterial infection for the selection of the PK-PD index, which significantly correlates with the ENR potency against E. coli. In this study, the PD targets for various antibacterial effects were also evaluated. It has been suggested that these parameters can be employed with MIC90 data to cure a diversity of E. coli infections and to obtain a rational dosage schedule for optimizing the efficacy of both clinical and simulated treatments.
Results
In-vitro susceptibility testing
The MIC distribution of 67 E. coli strains to ENR tested in mice plasma is depicted in Fig. 1. The MIC50 for ENR was found to be 0.25 μg/mL. The MIC values in MHB were approximately 1.7 times higher than those MIC values tested in mice plasma. To the designated E. coli strain Heilong 15, MIC values in MHB and mice plasma were 0.43 μg/mL and 0.25 μg/mL, respectively. The MIC values in MHB and mice plasma of 15 E. coli strains which were found close to the MIC50 are shown in Table. 1.

ENR MIC distribution of 67 Escherichia coli strains. On the X-axis, MIC values were given while Y-axis represents strain number in all MIC values.
PK of ENR and CIP in neutropenic thigh infected mice
The time courses of the mean plasma ENR concentrations in neutropenic infected mice following a single dose of 1.25, 2.5, 5, and 10 mg/kg (injected subcutaneously), are depicted in Fig. 2, while Table. 2 represents the concentration of CIP. The primary PK parameters of ENR are shown in Table. 3. The AUC and Cmax values of ENR were 0.62 ~ 3.14 μg.h/mL and 0.27 ~ 1.97 μg/mL, respectively. The elevation was observed in AUC and Cmax values with increasing dose concentration (1.25–10 mg/kg), while the range of T1/2e values was from 1.35 to 1.65 h. Post 10 h, the ENR concentration in plasma was decreased below the detection limit, so, its detection could not be possible.

The ENR concentration-time course following single s.c injection of 1.25, 2.5, 5, and 10 mg/kg
In-vitro antimicrobial activity
The in-vitro killing curve which indicates that ENR is a drug that depends on concentration is depicted in Fig. 3. When exposed to the increased concentration of ENR (16 MIC or 32 MIC), the bacterial CFUs were considerably reduced to unnoticeable levels (<10 CFU). As the concentration reached > 4 × MIC, ENR reached the level where it inhibits the bacterial growth, while the killing of bacteria was found to be at <3log CFU/mL.

The in-vitro killing curve of ENR against E. coli (Heilong 15). (A). Antibacterial effect starting with a bacterial density of 106 CFU/mL (B) Antibacterial effects starting with a bacterial density of 108 CFU/mL
PK-PD integration and modeling
At the beginning of the therapy, mice had 5.35 log10 CFU/ thigh almost 4 h post-inoculation. In the control group (untreated), the bacterial capacity reached 7.55 log10 CFU/thigh across the overnight treatment. The increased antibacterial effects in the experimental group were decreased to a rate of 2.67 ± 0.25 per thigh 24 h post-treatment. The antibacterial effects are indicated in Fig. 4. The key PK/PD parameters are given in Table. 4. In this model, the AUC/MIC was considered as the best PK-PD Index of the antibacterial effect (R2 = 0.9928). The association between the PK-PD Index and the antibacterial effect is indicated in Figs. 5 and 6. The bacteriostatic action, 1-log10 reduction, 2-log10 reduction, and 3- log 10 reductions were obtained when the dividing AUC/MIC by 24 h reached 0.325, 0.4375, 0.63, and 0.95, accordingly.

In-vivo ENR PD studies via murine neutropenic thigh infection model. Each symbol shows the mean value of thigh bacterial infection from five infected mice (Escherichia coli Heilong 15). Twelve dose regimens of ENR were used to treat the E. coli Heilong 15 infection. The variations in the log10 number of colony-forming unit (CFU)/thigh were evaluated in the beginning and post 24 hrs of treatment. Data points under the horizontal dashed line indicate killing and points above the horizontal dashed line showed growth and development

Relationship between AUC/MIC and E. E is defined as the reduction of bacterial count post 24 hrs of treatment. R2 represents the correlation coefficient

Relationship between Cmax/MIC and E. E is defined as the reduction of bacterial count post 24 hrs of treatment. R2 represents the correlation coefficient
Estimation of doses
The doses estimated for dairy cattle, steer, and pig are shown in Table. 5.
Discussion
The PK studies of ENR and its metabolites have been carried out in various animals, such as broilers, foals, goats, calves, dairy cows, swine, goats, and buffalo calves [17, 19, 21, 23,24,25]. In the present study, the mean value of ENR T1/2e in plasma was 1.48 h in mice post single injection (s.c.), which is almost similar to the previous studies [26, 27]. However, the T1/2e value in the existing study was considerably lower than foals (17.10 h), dairy cows (3.69 h), beef steers (5.15 h), swine (6.69 h), and buffalo calves (5.14 h) [17, 19, 21, 23]. In the existing research work, the Cmax value in the neutropenic mice (at 2.5 mg/kg dose) was 0.27 μg/m and was found to be lower as compared with the swine (1.09 μg/mL) [19]. At 5 mg/kg dose, the value was 0.51 μg/mL that was considerably lower than the value in the goat (4.30 μg/mL) [25]. The AUC of this study at the dosage of 10 mg/kg was found to be 3.14 μg.h/mL that was considerably decreased than the AUC of turkey (23.76 μg.h/mL) at the same dose [28]. The leading cause of variations in the values may be due to diverse animal species. In the present study, the dose was proportional to both the AUC and Cmax values. The metabolite conversion ratio of CIP was 5–10%, which showed similarity to the earlier studies [27, 29]. However, the metabolic conversion ratio in mice was found to be considerably lower than that in the dairy cow (59%), in beef steers (64%), and buffalo calves (47%) [17, 21]. Similar observations have also been found in other PK / PD models of ENR [19, 24]. In various types of animals, the rate of conversion of ENR to CIP is relatively different. Ciprofloxacin, a metabolite of ENR, has at least the same antibacterial effect as ENR [30]. In particular, the conversion rate should be taken into account in the calculation of dosage. If we just consider ENR’s antibacterial effect and disregard Ciprofloxacin’s antibacterial effect, the measured dose would be too high, which is not good for animal health, particularly in animal species with high conversion rates like dairy cows and steers.
Previous studies have suggested that the higher MIC value calculated in MHB than in similar biological matrices might be artificially elevated [31, 32]. As a result, the MIC from biological matrix samples is needed rather than MHB. In this study, the values of MIC in MHB were found to be higher (1.7 times) than the MIC values in mice plasma. In the previous study, the MIC values tested in MHB were reported 8 times higher than those tested in mice serum [33]. Hence, it is necessary to measure the values of MIC in the corresponding biological matrix that provides a guarantee for the integrated PK-PD model in the following step. The larger MIC values caused via the measured liquid matrix will lead to the relatively smaller PK-PD indexes. As a result, PD target values will be lower which tends to decrease dosage by calculating.
PK-PD modeling is an effective tool in the veterinary field which explores the impact of drugs against microbes and, hence, it is recommended to be used in the preclinical and clinical development of veterinary drugs for optimizing the dosing approach [5, 8]. The selection of a highly effective PK/PD index is regarded as an important step. Fluoroquinolone is mainly categorized as an antimicrobial drug that is dependent on concentration [34]. In the earlier studies, the PK-PD index AUC/MIC and Cmax/MIC indicated a strong association with the activities against bacteria [35]. In this study, through the in-vitro killing curve and in-vivo PD studies, ENR exhibited classic concentration-dependent characteristics. The correlation indices (R2 values) of the AUC/MIC, Cmax/MIC, and %T > MIC were 0.9929, 0.9783, and 0.8371, accordingly. Based on R2 values, the AUC/MIC exhibited an elevated prediction of the antimicrobial effect, which showed similarity with the earlier study [35, 36]. However, using the AUC/MIC to investigate the breakpoints, the time dimension possessed by this PK-PD index makes researchers confused. Compared with the AUC/MIC, dividing the AUC/MIC by the time interval is a more universal metric that can be used not only as a scoring figure but also for computing different doses [7]. In the current study, results indicated that dividing the AUC/MIC by 24 h required for bacteriostatic action, the 1-log10 reduction, 2-log10 reduction, and a 3-log10 reduction was 0.325, 0.4375, 0.63, and 0.95, accordingly. These values were considerably lower than the values of the earlier studies that reported ENR concentration in intestinal contents of swine and broiler chicken, rather than the ENR concentration in plasma [19, 24]. Earlier studies have revealed that the ENR concentration in tissues has been increased as compared with the plasma, particularly in lung tissues, and the T1/2e of ENR in tissues was longer than that in plasma [27]. To achieve the 3-log10 reduction in vivo, a 0.95 value of dividing the AUC/MIC by 24 h needs to be achieved. It means that maintaining an average plasma concentration of ENR equal to 95% of the corresponding MIC is necessary over the dosing interval of 24 h. The reason for this result may be related to Antimicrobial Susceptibility Testing. Antimicrobial Susceptibility Testing does not take into consideration factors such as disease severity and pathogen load in the biophase [37]. Those factors may influence treatment outcomes. In the current study, to be consistent with the situation in vivo, mice plasma was used as a biological matrix to determine MIC. Despite this approach, many clinical factors, such as time of initiation relative to the development of the disease and individual differences, influence the outcome [38].
The neutropenic mouse thigh infection model is usually used for the prediction of the therapeutic dose and antibacterial effect for veterinary drugs [39]. Based on the current calculation, when the MIC90 was 0.25 μg/mL, the daily dose for dairy cattle to achieve -1log10 reduction and -3log10 reduction was 4.05 mg/kg and 11.1 mg/kg. For the steers, the doses were 1.42 mg/kg and 6.78 mg/kg. The reasons for the gap include the different clearance of ENR in dairy cows, steers, and the difference in plasma protein binding. The clearance of dairy cows is almost twice that of steers. The plasma proteins of dairy cows and steers are 59.4 and 60.8%. The conversion rate is very low in pigs, which was estimated to be 10% according to the previous report [22]. For pigs, the daily doses to achieve -1log10 reduction and -3log10 reduction were 0.66 mg/kg and 1.45 mg/kg. The calculated dose is similar to that calculated by Wang et al. [19]. The three MIC cut-off values needed to assist the selection of Clinical Breakpoint (CBP) comprising epidemiological cut-off values described by EUCAST as the ECOFF, PK/PD cut-off named by EUCAST as the PK/PD breakpoint, and, in veterinary medicine, a MIC cut-off related to clinical outcomes [37]. The ECOFF value of ENR against E. coli was 0.125 μg/mL (https://mic.eucast.org/Eucast2/SearchController/search.jsp?action=performSearch&BeginIndex=0&Micdif=mic&NumberIndex=50&Antib=-1&Specium=162). The value of selected MIC (0.25 μg/mL) covered the ECOFF. Based on the calculation, the current dose of 2.5 mg/kg can achieve the therapeutic effect for pigs, fail to achieve the therapeutic effect either for a dairy cow or for a steer. The emergence of bacterial resistance in dairy cows and steer is related to the nonstandard use of ENR in China for many years. Due to this situation, it is necessary to control drug resistance with a reasonable dose. According to published reports, fluoroquinolone resistance is steadily growing in China, with ENR resistance being the most prominent [40, 41]. Earlier studies have revealed that in Shandong province and Anhui province, the E. coli resistance rate for ENR was 67.5 and 56.4%, accordingly [41, 42]. While in eastern China, the rate of E. coli resistance to fluoroquinolone was estimated as 62.09–69.78% [43]. ENR has been used in China for several years and, in many farmlands, its usage is not regulated properly where the ranchers and farmers misuse this antibiotic. This may cause the plasmid-mediated ENR resistance to spread among bacteria, leading to the resistance against drugs [44]. Three mechanisms for plasmid-mediated fluoroquinolone resistance (PMQR) have been revealed including the Qnr (qnrA, qnrB, qnrC, qnrD, and qnrS) proteins, the aac (6′)-Ib-cr enzyme, and QepA and OqxAB plasmid-mediated efflux pumps [45, 46]. Antibiotic resistance is emerging at an alarming level in the world, and because of this problem, the PK-PD model was used to design reasonable drug doses. Several approaches such as the use of drug combinations have been recommended to significantly enhance the antibacterial effect [47]. The combined use of β-lactam and fluoroquinolones has been indicated to be effective for treating Gram-negative bacteria [48]. Their combined effect will overcome the problem of bacterial resistance. It should be noted that the theoretical values obtained from the experiment need to be verified in clinical field.
Several limitations are associated with this model. Firstly, the infection induced in the laboratory model cannot be the same as the natural infection. As a single microorganism is used for inducing infections in laboratory models, such as in the existing experimental model, only E. coli was used for infection. But, natural infections are mostly caused by many types of microbes. Secondly, individual differences in laboratory animals may lead to differences in results, thus cause instability. Future research should take these points into account.
Conclusion
A neutropenic thigh infection model was employed for the evaluation of in-vivo PK and PD parameters of ENR against E. coli. The correlation of the PK-PD index (AUC/MIC) with the antibacterial activity was found to be the strongest. Moreover, the findings of this study showed the bacteriostatic effect, 1-log10 reduction, 2-log10 reduction, and 3-log10 reduction of the bacterial count when dividing the AUC/MIC by 24 h reached 0.325, 0.4375, 0.63, and 0.95, accordingly. Our study provides significant results about the pharmacological profile of ENR that could help in improving its clinical use against colibacillosis.
Materials and methods
Chemicals, organisms, and animals
Ciprofloxacin (CIP) and Enrofloxacin (ENR) with 98% purity were procured from Shanghai Aladdin Bio-Chem Technology Co., Ltd. (Shanghai, China). The solutions of antimicrobial agents (test solutions) were freshly prepared before use. The culture medium used in this experiment was purchased from Hope Biol-Technology Co. Ltd. (Qingdao, Ching). Acetonitrile was purchased from TEDIA (Fairfield, CT, USA). All reagents used in this experiment were of high-performance liquid chromatography (HPLC) grade.
The selected pathogenic E. coli strain (n = 15) was previously isolated from the dairy cow suffered from colibacillosis in the Heilongjiang Province of China. The strain was employed for the PD evaluation and developing the E. coli infection model. A completely characterized E. coli strain i.e., ATCC25922 was procured from the China Institute of Veterinary Drug Control. All strains were frozen in a − 80 °C refrigerator until use. To preserve bacterial culture, the bacterial cultures were sub-cultured on Mueller-Hinton agar, followed by incubation for 24 h at 37 °C.
Six weeks-old specific pathogen-free (SPF) ICR mice (female), with body weight of 30–35 g were acquired from Beijing Vital River Laboratory Animal Technology CO., Ltd. (Beijing, China). These mice were housed under SPF maintained conditions with 12 h (1:1) of light and dark cycle and sterile feeds. Mice were maintained according to the guidelines of the American Association for Accreditation of Laboratory Animal Care [13]. All animal experiment procedures were approved by the Laboratory Animal Welfare and Ethics Committee of Northeast Agricultural University (NEAUEC20190629). The study was carried out in compliance with the ARRIVE guidelines.
In-vitro susceptibility studies
In the Heilongjiang province of China, a total of 67 clinical strains of bacteria were collected from dead dairy cows (died of colibacillosis) between 2016 and 2018. Mueller Hinton Broth (MHB) and mouse plasma were used for the MIC determination of ENR against E. coli via micro dilution methods, following the recommendations of Clinical and Laboratory Standards [14]. Briefly, colonies were transferred into MHB and placed on a shaking incubator at 37 °C (220 rpm) for 6 h [having reached 108 CFU/mL]. A series of two-fold dilutions of drug concentration was achieved by adding 100 μL culture aliquots to a 96-well plate. The MIC was considered the lowest concentration of ENR to inhibit apparent bacterial growth in matrices after 24 h’ incubation. Susceptibility test was performed in triplicate, and E. coli ATCC25922 was used as a control strain. Three overlapping sets of doubling dilutions were used to improve the accuracy of the MIC determinations (0.0068–55, 0.0078–64, and 0.0088–72 μg/mL). The QC of the control strain E. coli ATCC25922 was 0.008–0.03 μg/mL. SPSS Ver. 16 (IBM, Armonk, NY, USA) was used for the determination of MIC50 to analyze the population PD of ENR against the clinical strains of E. coli. For the establishment of the infection model, an appropriate clinical strain of E. coli was selected based on the ENR distribution of MIC.
Neutropenic mouse thigh infection model
To induce profound and sustained neutropenia (< 100 neutrophils/mm3), cyclophosphamide was injected into ICR mice (female) intraperitoneally as described previously i.e., 150 mg/kg daily for 4 days and then one dose at 100 mg/kg on day 5 [15, 16]. The thigh infection model was established by a 0.1 mL inoculum injection (intramuscular), in each thigh i.e., four thighs per group per time point.
Both bacterial cultures were incubated for 24 h to achieve the exponential phase of bacterial growth. These cultures were then injected into the thigh of mice after dilution, the bacterial counts of the inoculums reached 106 CFU/mL.
Establishment of HPLC for detection of drug concentration
ENR and CIP plasma concentration were determined using a Shimadzu LC-20AT series reverse-phase HPLC as described previously [17]. Briefly, 300 μL acetonitrile was combined with 100 μL plasma and the mixture was vortexed for 5 min. The mixture was then centrifuged at 7500 g for 10 min, followed by evaporating the supernatant at 60 °C under nitrogen. The residues were constituted in a 200 μL mobile phase and vortexed. From the reconstituted sample, an aliquot (20 μL) was injected into the HPLC system. To investigate the detection of ENR and CIP, the detection of PAD and spectral data were recorded at 278 nm wavelength (at ambient temperature i.e., 25 °C). The retention times of ENR and CIP in plasma were found to be 9.0 ± 0.5 min and 7.0 ± 0.5 min, respectively. The retention times of both ENR and CIP in extracted plasma samples were found to be similar to the peak of respective standards, as displayed in figure (Fig. 7).
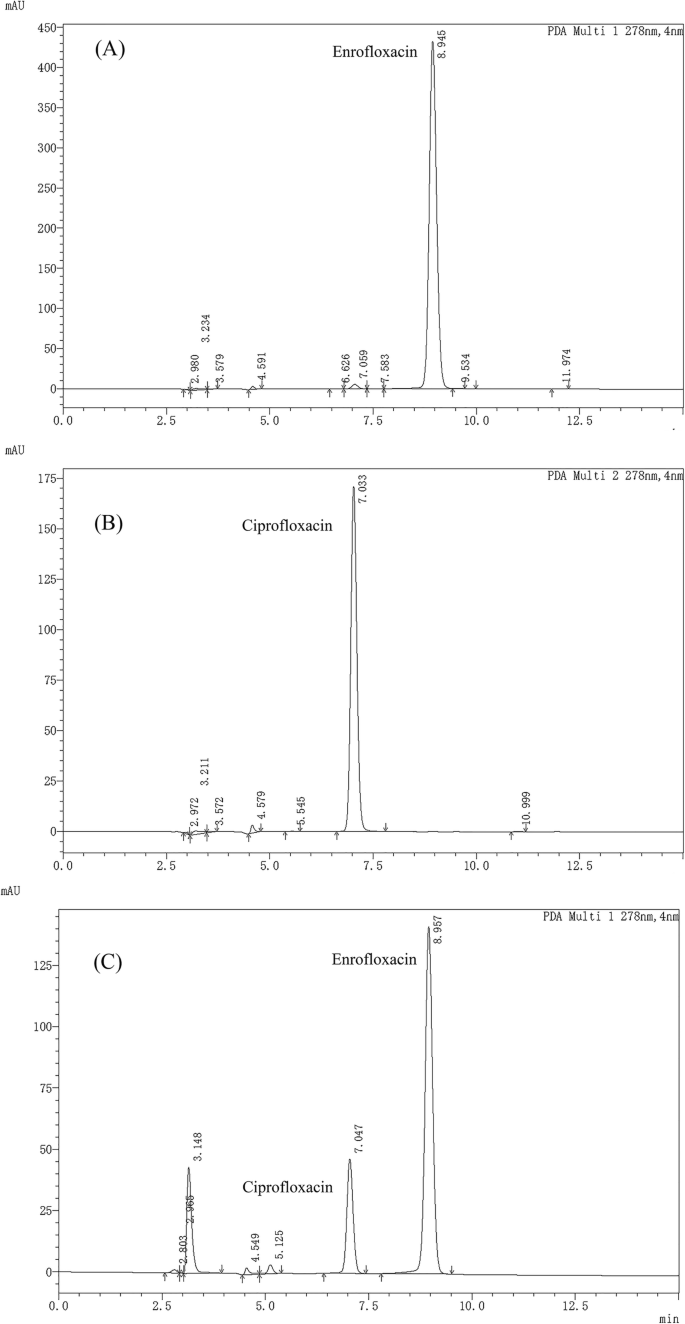
The chromatogram of standard solution and test sample. (A) depicts the chromatogram of standard ENR solution, (B) depicts the chromatogram of standard CIP solution, while (C) shows the chromatogram of an isolated test sample that contain ENR along with its metabolite CIP
The linearity of ENR and CIP quantitation was within 0.01–5 μg/mL, while the correlation coefficient (R2) of both antibiotics was found to be greater than 0.99. The ENR and CIP extraction recovery from plasma was greater than 80%, while their coefficients of variation were less than 10% within runs and between runs. The detection and quantification limits were 0.005 μg/mL and 0.01 μg/mL, respectively. Winnonlin ver. 5.2.1 (Pharsight, Saint Louis, MO, USA) was employed for the evaluation of PK parameters, such as T1/2e (the elimination half-life), AUC (area under plasma concentration-time curve), Cmax (maximum concentration in plasma), and Tmax (time of maximum plasma concentration).
Pharmacokinetic experiment
To determine the single-dose PK parameters of ENR and CIP in neutropenic mouse thigh infection model, a 0.2 mL injection of ENR with various concentrations such as1.25, 2.5, 5.0, and 10.0 mg/kg body weight was administered. After administration of ENR, blood samples were taken via retro-orbital puncture at 0.083, 0.167, 0.25, 0.5, 0.75, 1, 2, 4, 6, 8, 10, 12, and 24 h, and were collected into 1.5 mL heparinized sodium tubes, followed by centrifugation (4000×g for 10 min at 4 °C). The plasma portion was isolated and frozen at − 80 °C until further use. The sampling of each mouse was performed at one or two time points to reduce inter-animal variability, improve PK data accuracy, and minimize the number of mice used for experiments. The underlined blood sampling strategy is relatively less stressful and closer to acceptable animal welfare. Proper management of sedation was administrated as reported earlier [18]. The mice were kept in an induction chamber with conditions of oxygen flow rate at 0.5 to 1.0 L/min. Vaporized isoflurane (3–5%) was employed as induction and was subsequently decreased (1–3%) for maintenance.
In-vitro killing curves and in-vivo PD evaluation
To assess the anti-infective potential of the antibiotic, in-vitro bacterial killing curves were analyzed according to the previously reported method [19]. In-vitro bacterial killing curves were constructed in the MHB. An overnight incubated bacterial culture was diluted to 106 CFU/mL or 108 CFU/mL, followed by incubation of the high-density-pathogens and low-density-pathogens groups with 0.5 × MIC, 1 × MIC, 2 × MIC, 4 × MIC, 8 × MIC, 16 × MIC, and 32 × MIC ENR at 37 °C, accordingly. Samples were then evaluated at 1, 3, 6, 9, 12, and 24 h of incubation. At each time point, the serial dilutions of 100 μL culture were prepared in sterile saline and added to trypticase soy agar (TSA) plates. The visible bacterial colonies were counted after 12 h. The detection limit was found to be 100 CFU/mL. After the establishment of the neutropenic thigh infection model, the mice were randomized into 12 experimental groups (n = 5 per group). After four hours of E. coli Heilong 15 inoculation, these experimental groups were exposed to ENR via s.c. delivery. This was selected as the 0.0 h time point for the treatment. The doses were 1.25, 2.5, 5, 10 mg/kg at each 8, 12, and 24 h, respectively. After 24 h of ENR treatment, each mouse of the experimental group was sacrificed via CO2 asphyxiation. Mice allocated to the control group (untreated) were sacrificed before the 0.0 h time point for ENR treatment and 24 h post-treatment (n = 5 per timepoint). The colony counting in the homogenate of the thigh was conducted according to the previously reported method [20]. Each sample was taken from the thigh area aseptically, followed by homogenizing in 5 mL sterilized saline solution and then, 10-fold serial dilution of homogenates was prepared. One hundred microliters of all thigh homogenate dilutions were transferred into TSA media plates. Each sample was determined in triplicate. Finally, the bacterial colonies were counted on TSA media plates after a period of 12 h incubation at 37 °C, and the obtained data were analyzed via mean values. The LOD was 100 CFU/mL.
PK-PD integration and modeling
The Inhibitory Effect Sigmoid Emax Model in the WinNonlin software (version 5.2.1, Pharsight, St. Louis, MO, USA) was used to simulate the relationship between indexes AUC/MIC, Cmax/MIC of ENR, and in vivo effectiveness.
Herein “E” depicts the antibacterial effect (determined as the alteration in bacterial counts (log CFU/thigh) in the sample 24 h post-treatment, compared with the initial number of visible colonies; Emax is △logCFU24 h in the control sample (drug-free); E0 is △logCFU24 h in the experimental sample comprising ENR when the maximum potential against bacterial growth was obtained; Ce is the PK-PD index (AUC/MIC, %T > MIC and Cmax/MIC for the drug concentration in plasma); EC50 represents the PK-PD index for the drug which shows 50% of the highest antibacterial effect; N represents Hill coefficient (demonstrating the steepness of the effect curve obtained from PK-PD index). The variance (that might be caused via regression with PK-PD indices) was estimated through the coefficient of determination.
Dose estimation
The following formula was used to estimate dosages in different magnitudes of efficiency (1-log10 reduction and 3-log10 reduction) to deduce an optimal regimen in dairy cows, steer, and pigs [7].
Plasma clearance is expressed in L/day. The factor is the dividing AUC/MIC by 24 h. MIC90 is the 90th percentile of MIC distribution. fu is the free (unbound) fraction. F is the absolute bioavailability. The clearance、fu、F and conversion rates were cited from the previous studies [21, 22].
Statistical analyses
ANOVA (analysis of variance) was employed for the statistical evaluation of obtained data. Bonferroni’s correction was applied for the analysis of statistical significance among groups. The P-value < 0.05 was found to be statistically significant.
Availability of data and materials
The datasets used and/or analyzed during the current study are available from the corresponding author on reasonable request.
Abbreviations
- AUC:
-
The area under the concentration-time curve
- AUC/MIC:
-
The area under the concentration-time curve to MIC ratio
- CBP:
-
Clinical breakpoint
- Cmax:
-
The peak concentration
- Cmax/MIC:
-
The peak concentration divided by the MIC
- ECOFF:
-
Epidemiological cutoff value [synonym of wild-type cutoff value (COWT)]
- HPLC:
-
High-performance liquid chromatography
- MBC:
-
Minimum bactericidal concentration
- MIC:
-
Minimum inhibitory concentration
- PK/PD:
-
Pharmacokinetic/pharmacodynamic
- T1/2e:
-
Elimination half-life
- Tmax:
-
The time to achieve maximum concentration
References
Guner YS, Malhotra A, Ford HR, Stein JE, Kelly LK. Association of Escherichia coli O157:H7 with necrotizing enterocolitis in a full-term infant. Pediatr Surg Int. 2009;25(5):459–63. https://doi.org/10.1007/s00383-009-2365-3.
Park ES, Jo S, Seong JK, Nam TC, Yang IS, Choi MC, et al. Effect of acupuncture in the treatment of young pigs with induced Escherichia coli diarrhea. J Vet Sci. 2003;4(2):125–8. https://doi.org/10.4142/jvs.2003.4.2.125.
Devreese M, Antonissen G, De Baere S, De Backer P, Croubels S. Effect of administration route and dose escalation on plasma and intestinal concentrations of enrofloxacin and ciprofloxacin in broiler chickens. BMC Vet Res. 2014;10(1):289. https://doi.org/10.1186/s12917-014-0289-1.
Goettsch W, Van PW, Nagelkerke N, Hendrix MGR, Buiting AGM, Petit PL, et al. Increasing resistance to fluoroquinolones in Escherichia coli from urinary tract infections in the Netherlands. J Antimicrob Chemother. 2000;46(2):223–8. https://doi.org/10.1093/jac/46.2.223.
Toutain PL, Lees P. Integration and modelling of pharmacokinetic and pharmacodynamic data to optimize dosage regimens in veterinary medicine. J Vet Pharmacol Ther. 2004;27(6):467–77. https://doi.org/10.1111/j.1365-2885.2004.00613.x.
Zhou YF, Bu MX, Liu P, Sun J, Liu YH, Liao XP. Epidemiological and PK/PD cutoff values determination and PK/PD-based dose assessment of gamithromycin against Haemophilus parasuis in piglets. BMC Vet Res. 2020;16(1):81. https://doi.org/10.1186/s12917-020-02300-y.
Toutain PL, Bousquet-Mélou A, Martinez M. AUC/MIC: a PK/PD index for antibiotics with a time dimension or simply a dimensionless scoring factor? J Antimicrob Chemother. 2007;60(6):1185–8. https://doi.org/10.1093/jac/dkm360.
Ahmad I, Huang LL, Hao HH, Sanders P, Yuan ZH. Application of PK/PD modeling in veterinary field: dose optimization and drug resistance prediction. Biomed Res Int. 2016;2016:5465678.
Zeng QL, Mei X, Su J, Li XH, Xiong WG, Lu Y, et al. Integrated pharmacokinetic–Pharmacodynamic (PK/PD) model to evaluate the in vivo antimicrobial activity of Marbofloxacin against Pasteurella multocida in piglets. BMC Vet Res. 2017;13(1):178. https://doi.org/10.1186/s12917-017-1099-z.
Bernhard F, Odedra R, Sordello S, Cardin R, Knechtle P. Pharmacokinetics-pharmacodynamics of enmetazobactam combined with cefepime in a neutropenic murine thigh infection model. Antimicrob Agents Chemother. 2020;64:e00078–20.
Melchers MJ, Van Mil AC, Lagarde C, Den Hartigh J, Mouton JW. Pharmacodynamics of ceftolozane combined with tazobactam against enterobacteriaceae in a neutropenic mouse thigh model. Antimicrob Agents Chemother. 2017;60:7272–9.
Ferran AA, Kesteman AS, Toutain PL, Bousquet-Mélou A. Pharmacokinetic/pharmacodynamic analysis of the influence of inoculum size on the selection of resistance in Escherichia coli by a quinolone in a mouse thigh bacterial infection model. Antimicrob Agents Chemother. 2009;53(8):3384–90. https://doi.org/10.1128/AAC.01347-08.
National Research Council. Guide for the care and use of laboratory animals. Washington, DC: National Academy Press; 1996.
CLSI, editor. Performance standards for antimicrobial disk and dilution susceptibility tests for bacteria isolated from animals: approved standard, 4th ed. CLSI document VET01. Wayne: Clinical and Laboratory Standards Institute; 2013.
Guo CN, Liao XP, Wang MR, Wang F, Yan CQ, Xiao X, et al. In vivo pharmacodynamics of cefquinome in a neutropenic mouse thigh model of Streptococcus suis serotype 2 at varied initial inoculum sizes. Antimicrob Agents Chemother. 2015;60:1114–20.
Shan Q, Liang CP, Wang J, Li JF, Zeng ZL. In vivo activity of cefquinome against Escherichia coli in the thighs of neutropenic mice. Antimicrob Agents Chemother. 2014;58(10):5943–6. https://doi.org/10.1128/AAC.03446-14.
Balaje RM, Sidhu PK, Kaur G, Rampal S. Mutant prevention concentration and PK–PD relationships of enrofloxacin for Pasteurella multocida in buffalo calves. Res Vet Sci. 2013;95(3):1114–24. https://doi.org/10.1016/j.rvsc.2013.07.019.
Zeng DP, Sun MZ, Lin ZM, Li M, Gehring R, Zeng ZL. Pharmacokinetics and pharmacodynamics of tildipirosin against Pasteurella multocida in a murine lung infection model. Front Microbiol. 2018;9:1038. https://doi.org/10.3389/fmicb.2018.01038.
Wang JY, Hao HH, Huang LL, Liu ZL, Chen DM, Yuan ZH. Pharmacokinetic and pharmacodynamic integration and modeling of enrofloxacin in swine for Escherichia coli. Front Microbiol. 2016;7:36.
Lepak AJ, Marchillo K, Craig WA, Andes DR. In vivo pharmacokinetics and pharmacodynamics of the lantibiotic NAI-107 in a neutropenic murine thigh infection model. Antimicrob Agents Chemother. 2015;59(2):1258–64. https://doi.org/10.1128/AAC.04444-14.
Idowu OR, Peggins JO, Cullison R, Bredow JV. Comparative pharmacokinetics of enrofloxacin and ciprofloxacin in lactating dairy cows and beef steers following intravenous administration of enrofloxacin. Res Vet Sci. 2010;89(2):230–5. https://doi.org/10.1016/j.rvsc.2009.12.019.
Messenger KM, Papich MG, Blikslager AT. Distribution of enrofloxacin and its active metabolite, using an in vivo ultrafiltration sampling technique after the injection of enrofloxacin to pigs. J Vet Pharmacol Ther. 2012;35(5):452–9. https://doi.org/10.1111/j.1365-2885.2011.01338.x.
Bermingham EC, Papich MG, Vivrette SL. Pharmacokinetics of enrofloxacin administered intravenously and orally to foals. Am J Vet Res. 2000;61(6):706–9. https://doi.org/10.2460/ajvr.2000.61.706.
Sang KN, Hao HH, Huang LL, Wang X, Yuan ZH. Pharmacokinetic–pharmacodynamic modeling of enrofloxacin against Escherichia coli in broilers. Front Vet Sci. 2016;2:80.
Rao GS, Ramesh S, Ahmad AH, Tripathi HC, Sharma LD, Malik JK. Effects of endotoxin-induced fever and probenecid on disposition of enrofloxacin and its metabolite ciprofloxacin after intravascular administration of enrofloxacin in goats. J Vet Pharmacol Ther. 2000;23:365–72.
Ogino T, Arai T. Pharmacokinetic interactions of flunixin meglumine and enrofloxacin in ICR mice. Exp Anim. 2007;56(2):79–84. https://doi.org/10.1538/expanim.56.79.
Yang F, Kang JJ, Yang F, Zhao ZS, Kong T, Zeng ZL. Preparation and evaluation of enrofloxacin microspheres and tissue distribution in rats. J Vet Sci. 2015;16(2):157–64. https://doi.org/10.4142/jvs.2015.16.2.157.
Dimitrova DJ, Lashev LD, Yanev SG, Pandova B. Pharmacokinetics of enrofloxacin in turkeys. Res Vet Sci. 2007;82(3):392–7. https://doi.org/10.1016/j.rvsc.2006.09.004.
Slana M, Pahor V, Maričič LC, Sollner-Dolenc M. Excretion pattern of enrofloxacin after oral treatment of chicken broilers. J Vet Pharmacol Ther. 2014;37(6):611–4. https://doi.org/10.1111/jvp.12130.
Anadón A, Martínez-Larrañaga MR, Díaz MJ, Fernández-Cruz ML, Martínez MA, Frejo MT, et al. Pharmacokinetic variables and tissue residues of enrofloxacin and ciprofloxacin in healthy pigs. Am J Vet Res. 1999;60(11):1377–82.
Aliabadi FS, Lees P. Pharmacokinetic–pharmacodynamic integration of danofloxacin in the calf. Res Vet Sci. 2003;74(3):247–59. https://doi.org/10.1016/S0034-5288(03)00005-5.
Zhou YF, Tao MT, Huo W, Liao XP, Sun J, Liu YH. In vivo pharmacokinetic and pharmacodynamic profiles of antofloxacin against Klebsiella pneumoniae in a neutropenic murine lung infection model. Antimicrob Agents Chemother. 2017;61:e02691–16.
Yang QW, Liu XS, Zhang CH, Yong K, Clifton AC, Ding HZ, et al. Pharmacokinetics and pharmacodynamics of gamithromycin treatment of Pasteurella multocida in a murine lung infection model. Front Pharmacol. 2019;10:1090. https://doi.org/10.3389/fphar.2019.01090.
Serrano-Rodríguez JM, Cárceles-García C, Cárceles-Rodríguez CM, Gabarda ML, Serrano-Caballero JM, Fernández-Varón E. Susceptibility and PK/PD relationships of Staphylococcus aureus strains from ovine and caprine with clinical mastitis against five veterinary fluoroquinolones. Vet Rec. 2017;180(15):376. https://doi.org/10.1136/vr.103964.
Xiao X, Jiang LJ, Lan WX, Jiang YJ, Wang ZQ. In vivo pharmacokinetic/pharmacodynamic modeling of Enrofloxacin against Escherichia coli in broiler chickens. BMC Vet Res. 2018;29:374.
Haritova A, Urumova V, Lutckanov M, Petrov V, Lashev L. Pharmacokinetic-pharmacodynamic indices of enrofloxacin in Escherichia coli O78/H12 infected chickens. Food Chem Toxicol. 2011;49(7):1530–6. https://doi.org/10.1016/j.fct.2011.03.044.
Toutain PL, Bousquet-Mélou A, Damborg P, Ferran AA, Mevius D, Pelligand L, et al. En Route towards European clinical breakpoints for veterinary antimicrobial susceptibility testing: a position paper explaining the VetCAST approach. Front Microbiol. 2017;8:2344.
Turnidge J, Paterson DL. Setting and revising antibacterial susceptibility breakpoints. Clin Microbiol Rev. 2007;20(3):391–408. https://doi.org/10.1128/CMR.00047-06.
Qu Y, Qiu ZZ, Cao CF, Lu Y, Sun MZ, Liang CP, et al. Pharmacokinetics/pharmacodynamics of marbofloxacin in a Pasteurella multocida serious murine lung infection model. BMC Vet Res. 2015;11(1):294. https://doi.org/10.1186/s12917-015-0608-1.
Dai L, Lu LM, Wu CM, Li BB, Huang SY, Wang SC, et al. Characterization of antimicrobial resistance among Escherichia coli isolates from chickens in China between 2001 and 2006. FEMS Microbiol Lett. 2008;286(2):178–83. https://doi.org/10.1111/j.1574-6968.2008.01272.x.
Li L, Wang BT, Feng S, Li JN, Wu CM, Wang Y, et al. Prevalence and characteristics of extended-spectrum β-lactamase and plasmid-mediated fluoroquinolone resistance genes in Escherichia coli isolated from chickens in Anhui province, China. PLoS One. 2014;9:e104356.
Xia LN, Li L, Wu CM, Liu YQ, Tao XQ, Dai L, et al. A survey of plasmid-mediated fluoroquinolone resistance genes from Escherichia coli isolates and their dissemination in Shandong, China. Foodborne Pathog Dis. 2010;7(2):207–15. https://doi.org/10.1089/fpd.2009.0378.
Lu LM, Dai L, Wang Y, Wu CM, Chen X, Li L, et al. Characterization of antimicrobial resistance and integrons among Escherichia coli isolated from animal farms in eastern China. Acta Trop. 2010;113(1):20–5. https://doi.org/10.1016/j.actatropica.2009.08.028.
Rodríguez-Martínez JM, Velasco C, García I, Cano ME, Martínez-Martínez L, Pascual A. Mutant prevention concentrations of fluoroquinolones for Enterobacteriaceae expressing the plasmid-carried quinolone resistance determinant qnrA1. Antimicrob Agents Chemother. 2007;51(6):2236–9. https://doi.org/10.1128/AAC.01444-06.
Robicsek A, Jacoby GA, Hooper DC. The worldwide emergence of plasmid-mediated quinolone resistance. Lancet Infect Dis. 2006;6(10):629–40. https://doi.org/10.1016/S1473-3099(06)70599-0.
Strahilevitz J, Jacoby GA, Hooper DC, Robicsek A. Plasmid-mediated quinolone resistance: a multifaceted threat. Clin Microbiol Rev. 2009;22(4):664–89. https://doi.org/10.1128/CMR.00016-09.
Tamma PD, Cosgrove SE, Maragakis LL. Combination therapy for treatment of infections with gram-negative bacteria. Clin Microbiol Rev. 2012;25(3):450–70. https://doi.org/10.1128/CMR.05041-11.
Al-Hasan MN, Wilson JW, Lahr BD, Thomsen KM, Eckel-Passow JE, Vetter EA, et al. Beta-lactam and fluoroquinolone combination antibiotic therapy for bacteremia caused by gram-negative bacilli. Antimicrob Agents Chemother. 2009;53(4):1386–94. https://doi.org/10.1128/AAC.01231-08.
Acknowledgments
Not applicable.
Funding
The existing research was sponsored via the National Key Research and Development Program of China (2016YFD0501310).
Author information
Authors and Affiliations
Contributions
The experiments were conceived and designed by LXS and LY. The experiments were performed by LXS, YQW, and FYY. The data were analyzed by DYY and LL. The manuscript was drafted by WD. All authors read and approved the final manuscript.
Corresponding author
Ethics declarations
Ethics approval and consent to participate
The present study was performed as suggested by the Laboratory Animal Welfare and Ethics Committee of Northeast Agricultural University and the American Association for Accreditation of Laboratory Animal Care guidelines. The approval for the protocol was provided by the Laboratory Animal Welfare and Ethics Committee of Northeast Agricultural University (NEAUEC20190629).
Consent for publication
Not applicable.
Competing interests
The authors declare that they have no competing interests.
Additional information
Publisher’s Note
Springer Nature remains neutral with regard to jurisdictional claims in published maps and institutional affiliations.
Rights and permissions
Open Access This article is licensed under a Creative Commons Attribution 4.0 International License, which permits use, sharing, adaptation, distribution and reproduction in any medium or format, as long as you give appropriate credit to the original author(s) and the source, provide a link to the Creative Commons licence, and indicate if changes were made. The images or other third party material in this article are included in the article's Creative Commons licence, unless indicated otherwise in a credit line to the material. If material is not included in the article's Creative Commons licence and your intended use is not permitted by statutory regulation or exceeds the permitted use, you will need to obtain permission directly from the copyright holder. To view a copy of this licence, visit http://creativecommons.org/licenses/by/4.0/. The Creative Commons Public Domain Dedication waiver (http://creativecommons.org/publicdomain/zero/1.0/) applies to the data made available in this article, unless otherwise stated in a credit line to the data.
About this article

Cite this article
Liu, X., Yang, Q., Fan, Y. et al. Pharmacokinetics and pharmacodynamics of enrofloxacin treatment of Escherichia coli in a murine thigh infection modeling. BMC Vet Res 17, 212 (2021). https://doi.org/10.1186/s12917-021-02908-8
Received:
Accepted:
Published:
DOI: https://doi.org/10.1186/s12917-021-02908-8